Suggestions
Welcome to the Redgate Monitor feature suggestions list. Tell us how we can improve Redgate Monitor by voting on these suggestions or by submitting your own ideas.
This is the easiest way to make an impact on Redgate Monitor’s roadmap. Check out the completed suggestions to see how your ideas have influenced us in the past. Please note that this list is one of multiple sources that drive our development, meaning that we will not always implement the highest-ranking suggestions.
To give your idea the greatest possible impact, please follow these guidelines:
- Describe the goal you’re trying to accomplish, rather than a specific solution to get there
- If you have a favoured solution, add it as a comment to your suggestion
- Give us as much context as possible
- Only make one suggestion per post. If you have multiple ideas, submit them in separate posts
- Comment and vote on existing posts to develop the ideas — the Redgate Monitor team will often stay quiet initially about new suggestions to see what you have to say!
If you have any questions visit the Redgate Monitor forum.
800 results found
-
Be able to see and dissect alerts for deadlocks on the AWS RDS platform.
Currently, SQL Monitor does not raise deadlock alerts for AWS RDS database instances. I'd like this functionality to be added, as it's a major feature and selling point for the product.
The current workaround we're using is a combination of AWS performance insights and a SQL script. A "single pane of glass" would be much more efficient.
1 vote -
Improve filters available for alerts
A recent incident I have been working on revealed to me that filters work based on last update which makes it hard to find alerts that you know would have started around a specific time. The ability to filter on start/end times as well as show this information in view returned.
1 vote -
Add Active/Ended as SELECT drop-down options for Events
The current Alerts page Select drop-down has None/All/Read/Unread
For events, such as Disk Space, being able to Select "Ended" to get rid of the noise, helps focus on what needs to be addressed.
If the list doesn't have any Event-type row, don't offer this pair of options.
1 vote -
Add link to disk details on Server details page.
From the Estate - Disk Usage tab we can select the specific drive to get usage details for that disk.
When you navigate to a server from the Overview there is a section that shows the Disk Usage at a high level, but no links to drill into the specific disk.1 vote -
annotation
I would like to be able to trigger an alert and notification when I use the RedgateSQM powershell module's Add-SqlMonitorAnnotation cmdlet.
1 vote -
Add Text Boxes/Areas to Reports
I have reports that I circulate from SQL Monitor. I have to edit these before I issue them to add additional information. E.g. Under the "Lock Waits/Sec" chart I have a description of what a "Lock Wait" is, what impact it has, what's an acceptable value, etc. I tried supplying a supplementary sheet with this info but the management team prefer it under each chart / metric.
1 vote -
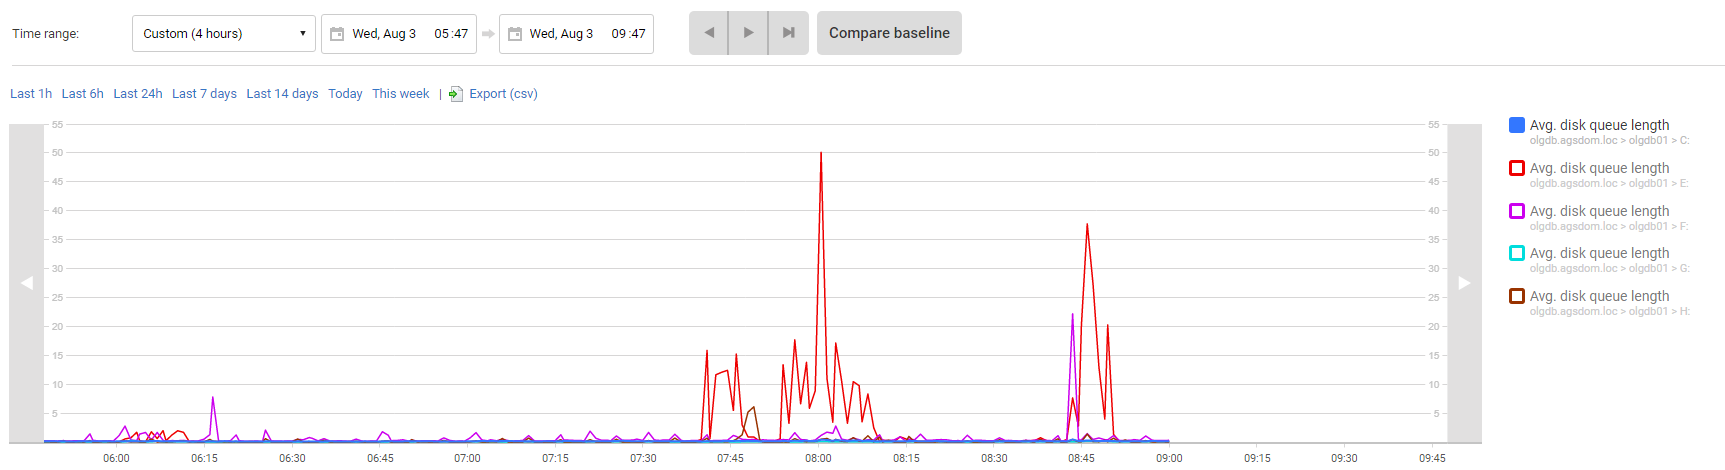
Disk space alert
The disk space alert can be configured on Server-Level as a host machine alert, but the alert is fired for every Instance on that host.
As example, we have 5 instances on a sever, each instance has it's own drive, e.g.
instance1 on drive d:
instance2 on drive e:
instance3 on drive f:
etc.If one instance, e.g. instance2 on drive e: is filling up it disk, the alert is fired for all instances. We would like to see an alert only for the instance that is affected and not 5 alerts.
1 vote -
Alerts and Notifications Export
Would love to be able to export all notifications with details into Excel or CSV. Very beneficial to create dashboards, metrics and KPI for all notifications.
1 vote -
Fragmented Indexes
Would like to add row count and fill factor to the alert as depending on how many rows there are depends on whether a reaction is needed
Fragmented indexes:
Index Table name Fragmentation(%) No. of pages1 vote -
Data Export
Export the top querys list with detail as excel file or can be mail to another person.
1 vote -
To show top server Process memory usage
Under the "Processes", it would that we can sort the top memory usage as well. There are times we got alert that the server memory usage is high and we need to know what other OS processes is utilizing the server memory other than SQL.
1 vote -
"Take Screenshot" Feature in Analysis Section
I have the need very often to take screenshots for non-technical management slideshows.
Could you add a button in the analysis panel to take a screenshot of the analysis timeline?
I would like to obtain something like this (with a single click)
https://images4.imagebam.com/c4/e9/b5/MEC1R73_o.png
Thank you
1 vote -
Remember the Filter Layout
On the Alert Inbox it would be nice to be able to re-arrange the filters and for the options to be remembered no matter where I login.
1 vote -
View stats for queries across databases and / or servers
Given that one has multiple similar databases, recieving the same queries, having same indexes and so forth. Currently one are able to view top-queries on server and database level, but what would be very valuable is to see the same information across databases on a server and across servers where one would then match the query on a content of the query itself. Then one could pinpoint globally what queries that has high io / cpu / ... even tough they on a individual db-level is not "high"
1 vote -
Save alert email addresses
I monitor a large enterprise and forward hundreds of alerts using cut/paste. If recent addresses were retained, it would save a lot of time.
1 vote -
report to show Job status completed or failed. last run time and next run time
report to show Job status completed or failed. last run time and next run time
1 vote -
Environment specific Reports
As we have option to create different reports on SQL Monitor, We would like to have the option to create the reports as per environment (Dev,UAT,Prod) for Disk Space,Server Downtime etc. It will be more feasible if we can get a filter to create reports for the specific environment.
1 vote -
See Transaction Isolation Levels in Blocking Alerts
There are two methods I have been using to understand blocking situations on our servers:
The processes tab in the Blocking Process alert
The blocking processes section in the server overviewI can get a lot of information from both of these methods but I don't seem to be able to get the isolation levels of the blocking or blocked queries which would be helpful in understanding why the blocking situation has occurred.
Prior to using SQL monitor, we used the blocked process report to monitor blocking and these include the isolation levels. Unfortunately, I still have to resort to…
1 vote -
I would like to set up an alert for disk space projection threshold
Wanted to know if we can set up and alert when it reaches the threshold of less than a month of projection for disk - this is in the disk monitoring estate for Redgate .
image.png
Regards,
Shaily.1 vote -
Number of rows returned by query
I'd like the ability to view the number of row returned by a query. Tools like Dynatace, XRebel, New Relic are able to display this and it's extremely useful in identifying queries that are selecting too many rows and in need for application logic / code rework.
1 vote
- Don't see your idea?