Suggestions
Welcome to the Redgate Monitor feature suggestions list. Tell us how we can improve Redgate Monitor by voting on these suggestions or by submitting your own ideas.
This is the easiest way to make an impact on Redgate Monitor’s roadmap. Check out the completed suggestions to see how your ideas have influenced us in the past. Please note that this list is one of multiple sources that drive our development, meaning that we will not always implement the highest-ranking suggestions.
To give your idea the greatest possible impact, please follow these guidelines:
- Describe the goal you’re trying to accomplish, rather than a specific solution to get there
- If you have a favoured solution, add it as a comment to your suggestion
- Give us as much context as possible
- Only make one suggestion per post. If you have multiple ideas, submit them in separate posts
- Comment and vote on existing posts to develop the ideas — the Redgate Monitor team will often stay quiet initially about new suggestions to see what you have to say!
If you have any questions visit the Redgate Monitor forum.
44 results found
-
Add button to hide new grouping and use old grouping
Although the grouping seemed interesting at first, it means now our servers don’t fit on our screen anymore.
I would suggest adding a button to the "Group by" header that says "no headers" (or maybe a checkbox somewhere).
This button (or checkbox) would show the "old" layout again with the grouping on the left side as here: https://www.red-gate.com/wp-content/uploads/2019/10/SQL-Monitor.png
There is much more horizontal screen real estate than there is vertical; because of these new grouping headers we now need to scroll to see our DEV servers.
I am fully aware I can click the headers to minimize the content but…
3 votesHi Andy.
Thanks for the feedback. Groups can be opened and closed and the card sizes can be changed to control the number of instances visible. We feel that it’s important to show the group headings on the dashboard.
Thanks,
Neil
(Lead product designer – SQL Monitor) -
Custom metrics in Analysis tab - allow grouping by metric type (machine / SQL Server instance / database)
In Analysis tab in the metric choice window all custom metrics are currently grouped together and sorted alphabetically. I'd like to see them grouped by type similar to the out-of-the-box metrics (machine / SQL Server instance / database) - the type could be a new parameter for each custom metric, manually entered / changed.
That would help when one has a lot of custom metrics.The result:
- Machine metrics
- SQL Server metrics
- Database metrics
- Custom machine metrics
- Custom SQL Server metrics
- Custom database metrics
- (maybe also this: Custom uncategorized metrics)?3 voteswe have found that this is not how people use custom metrics in general, so adding this split by default would go against the practices of most of our users – the best workaround for those that do have this split is to add a prefix to their custom metric name – they are ordered alphabetically
-
collect table scan density percentange
We would like to collect the "dbcc showcontig" table scan density percentage so that we can alert on levels below a certain percentage.
3 votesThe best way to do this is using custom metrics
-
Add scheduling for monitoring suspension and resumption
Using Azure SQL Database in serverless mode with an auto-pause is a useful feature to save money when the db is not in use. SQL Monitor keeps the db from sleeping overnight.
Suggest addition of scheduling for Suspend/Resume operations, similar to alert suppression scheduling.
3 votesHi, you should be able to use the SQL Monitor API (see https://documentation.red-gate.com/sm/api) to schedule suspending/resuming monitoring for your Azure SQL Databases.
-
Some alerts show 2 different time zones on a single alert event
On the alerts page I open a Database Unavailable alert that indicates a time of 10pm. The new page opens, and I see "Time raised = 10pm" but on the Details tab I see "Time = 6am"... it's showing UTC time instead of local time here. (Unless I've got something misconfigured!)
2 votesThanks – tracking this as a bug
-
Compact mode
The new "touch friendly" layout is annoying and wastes a lot of screen real estate. Please add a compact mode.
2 votesSorry, we and most users disagree
-
Multiple "Send From" Address
I'd like to be able to configure multiple send from email addresses so that i can configure different ring tones for my blackberry based on the email address
2 votes -
A Comprehensive Manual for SQL Monitor
Currently there is a serious lack of information about SQL Monitor and that's bad for everyone and not just the user base for DPA. Therefore DPA needs a head to toe, top-down comprehensive manual that details every single aspect of DPA from the metrics it captures to the settings it uses and every single function/feature no matter how insignificant needs to be documented in a single manual/guide. When complete there should not be any part of DPA that is not detailed in this manual. While I can see no reason for why something this comprehensive would not be made available…
1 voteFor SQL Monitor, in addition to the official documentation (https://documentation.red-gate.com/display/SM5/SQL+Monitor+5+documentation), there is a very comprehensive guide written up on SimpleTalk:
https://www.simple-talk.com/sql/sql-tools/sql-server-performance-troubleshooting-with-sql-monitor-5/
For DPA on the other hand, I think the good people of Solarwinds are better equipped than us Redgaters to document their tool ;)
-
Index on msdb..backupset
One of my servers has a db with many filegroups and does log backups every 5 min. For this reason the msdb..backupset table is very big and SQL Monitors query
SELECT DBNAME(DBID([databasename])) AS [DBNAME(DBID([databasename]]))], MAX([backupfinishdate]) AS [MAX([backupfinishdate]])], MAX([backupstartdate]) AS [MAX([backupstartdate]])], [type] AS [[type]]] FROM msdb..backupset WITH ( NOLOCK ) WHERE DBID([databasename]) IS NOT NULL GROUP BY DBNAME(DBID([database_name])), [type]reads ~3,500 pages per execution (CLUSTERED INDEX Scan) -> one of the TOP 10 queries (at least in the night :-)).
The following index…
1 voteSorry, we can’t add indexes to our users’ production servers to speed up our queries!
-
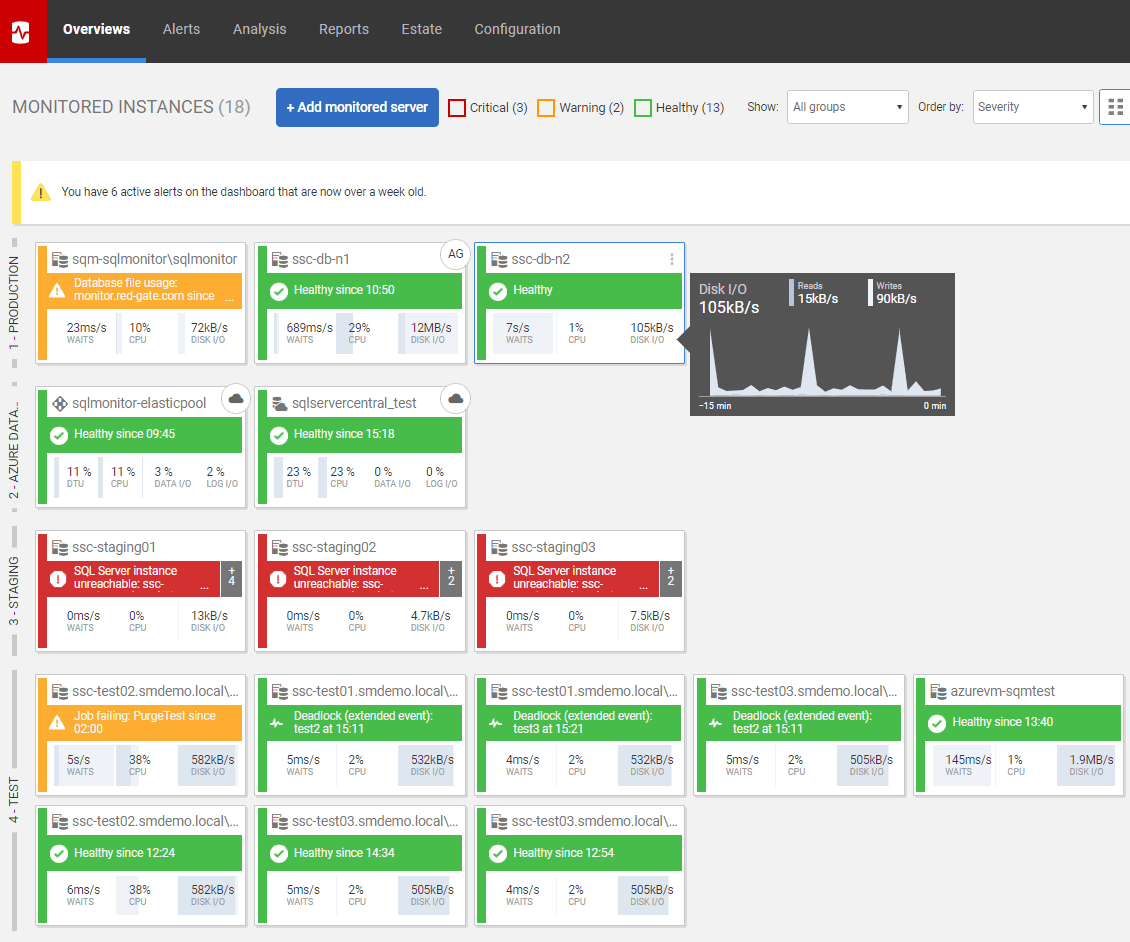
MONITORED INSTANCES
Hello good day
When you enter the Global Dashboard session, it stays loaded and shows the blank page.Annex image of the page.
1 voteApologies that this was overlooked when the problem was reported. We believe this bug was fixed shortly after and are closing this suggestion.
If you believe this bug is still valid, please raise it on the SQL Monitor Support Forum at https://forum.red-gate.com/categories/sql-monitor-7
-
handle case insensitivity with regex
We can configure some alerts to be ignored based on names/objects that are matched using reguler expressions.
Regex is case sensitive, but to avoid having to put all possible combinations in the regex boxes, could that be handled internally by SQL Monitor - for example by uppercasing (or lowercasing) all text before comparing?1 voteHi,
SQL Monitor supports all standard .NET regex characters, and uses the IgnoreCase option. All regular expressions are therefore case-insensitive.
Thanks,
Neil Turner
(SQL Monitor product designer) -
Another Field to Change the Display Order of Servers on the Dashboard
On the dashboard, server instances are currently ordered by two fields - Name or Severity which is selected via a drop down list. Can we have another field - Sort ID (int), to give users another way to sort? This field can either be hidden or displayed.
1 voteHi Dean,
This is currently possible by setting an alias for an instance (hover over the righthand corner for a card, click the menu icon and select ‘Alias…’).For example you might set:
1_AliasA
2_AliasBSelecting ‘Order by Name’ in the drop down will then allow you to use this ordering within a group on the dashboard.
Alternatively you can pin instances to the top of the dashboard (hover over the righthand corner for a card, click the menu and select ‘Pin to top’).
I hope that helps.
Neil Turner
SQL Monitor design lead -
removed an evicted node
I would like the ability to remove an evicted node from a cluster. As of today, we have one in such a state and there is no option to manually remove just that single node from "Manage Servers".
1 vote(reason: bug report)
Hi Matthew, SQL Monitor should automatically remove evicted nodes after a short period of time – if it doesn’t please contact support and we’ll do our best to resolve the issue
-
have help page on server where red gate installed . server can not get to internet
have help pages on server where red gate installed . server can not get to internet to get help info as it is secure site
1 votemuch of our help cross-references external sources, so an offline help would be less valuable (and increase the installer size)
-
Option to display time zone with time display.
Example:
Long-running query Server1 2:05 AM (UTC-5)
Blocking Server2 8:15PM (UTC+2)etc.
Thanks
1 voteAll times are shown in accordance to the browser’s timezone
-
Navigation Inconsistent
This is minor, but but it seems the links in the header on the alert detail page should link to the alerts page for that instance, not the overview.
1 voteI agree it’s counterintuitive, but it’s intentional
-
SQL Server agent job alert
Say somehow the sql server monitor wasn't enabled and some job failed on one of the monitored servers that time; when the SQL Server monitor comes back online I would appreciate, it showing this error, in the same manner, the monitor tool shows the overdue alerts for Integrity check, backups etc
1 voteWe decided against this in order to avoid a scenario where users are greeted by an onslaught of Job Failure alerts when they add a new monitored server
-
Allow use of non-administrative shares
Instance-level monitoring requires the use of the default administrative shares, which are likely to be disabled on hardened production servers.
Allowing the use of user-specified shares on a per instance basis would provide a means of getting around this restriction.
1 votesorry, can’t do – Microsoft’s APIs are too flakey
-
add custom metric for tracking use of deprecated features
I think it should be possible, using Extended Events or some other method, to create a custom metric that allows SQL Monitor to track the use of deprecated features. This data is useful for upgrade planning or best practice reviews. I realize some of this can be found via server-side tracing, but I have heard that Extended Events may be more efficient.
1 voteWe tend to avoid sharing custom metrics that affect server state (such as creating a new XE). However, you can implement this yourself – the following article should point you in the right direction: https://www.mssqltips.com/sqlservertip/1857/identify-deprecated-sql-server-code-with-extended-events/
-
The ability to publish custom metrics and alerts to your website for review and easy addition to community driven submissions. I have tested
The ability to publish custom metrics and alerts to your website for review and easy addition to community driven submissions. I have tested on my own systems and would like to quickly post up the custom metric and alerts I have created instead of current process.
1 voteCurrently we use an email submission system – our sumission volume is still too low to implement an automated process
- Don't see your idea?